5 Mini-portfolio
InformationName |
NoteMini-portfolio |
|
| Type (Main, Mini or Basket) | Mini | |
| Value | 5% (Path A) 0% (Path B) |
|
| Due | Thursday, February 3, 2022 at 3:03 p.m. ET | | |
| Submission instruction | Submission: Via Markus | | |
| Accommodations and extension policy | In the case of a personal illness/emergency, a declaration can be made, but must be submitted no more than 3 days after the due date. Extensions may be requested through the same form up to 48 hours before the due date. | |
Portfolio assessments aim to help you demonstrate your technical coding, statistical thinking, communication and reflection skills. This mini-portfolio also aims to recap and refresh knowledge from your previous statistics courses as well as building your ability to create quality data visualizations.
5.1 General instructions
Be very careful to follow instructions on variable naming. If you do not, your code won’t pass autograding and you will not receive the grades. This will not be eligible for regrading requests.
Comment your code! In an R code chunk comments start with a # (pound sign or hashtag symbol). Don’t confuse this with the use of # to denote different levels of headings in the text parts (governed by Markdown syntax) of an R Markdown document.
You should neatly format your code. No strict style is required, but make sure it is easy to read your work. (Optional) You may find Google’s R Style Guide or the Tidyverse Style Guide interesting.
DO include your code in the body of the PDF itself (don’t set echo=FALSE, don’t hide/suppress etc.). Note that this is different to what you will be asked to do in the final project or in professional reporting. This is a demonstration of your skills.
If asked to write and answer in words, write in full sentences.
KNIT EARLY AND OFTEN! Don’t leave things till the last minute, your Rmd not knitting is not an emergency for which an extension will be granted.
5.1.1 Template
You can access the template for this assessment here.
There is currently a lot of ‘filler text’ and ‘filler code’ in the template that you will want to delete. Fun fact: All filler text sourced from Hipster Ipsum, which Katy Wang in the UG Stats office introduced me to.
5.2 Submission instructions
- Submit both your Rmd (must be called: sta303-w22-mini-portfolio.Rmd) and PDF (must be called: sta303-w22-mini-portfolio.pdf) on MarkUs.
- You do not need to submit any data or tex files.
5.3 Cover page
You don’t have to use the provided template, but you DO need to write your mini-portfolio in RMarkdown and include a cover page. The cover page must have:
A title and subtitle (you can use my examples in the template or update them as you see fit, no points for changing, but it might make it a better part of your own website or GitHUb portfolio, in the future)
Your name
Date (assessment submission date is fine)
In the template, you can change the colour of this cover to any colour you would like by replacing 6C3082 in the YAML (line 11) to another hex code. You could use this tool to help you: https://htmlcolorcodes.com/color-picker/
5.4 Introduction
Write this section last or second to last (before the refection).
In the introduction section, write a brief summary of the skills you have demonstrated in this mini-portfolio, across the statistical skills sample, writing sample and reflection sections. Think of it like a cover letter for this document. It should be appropriate for a fairly general audience—imagine a future employer reading this. You may want to briefly explain the course context, as you understand it. What is STA303/1002 about? (Consider the learning objectives in the syllabus)
Your introduction should be no longer than 300 words and must fit on one page.
5.5 Statistical skills sample
5.5.1 Task 1: Setting up libraries
Set up a chunk called setup where you load the tidyverse and readxl libraries. Set your chunk options to message=FALSE so all the package loading information isn’t included in your our output. You will need to make sure you run this chunk each time you start a new session so you can use many of the functions required.
5.5.2 Task 2: Visualizing the variance of a Binomial random variable for varying proportions
Goal: Show visually that for a fixed value of \(n\), \(p=0.5\) will result in the largest variance for a Binomial random variable.
Choose two appropriate values of \(n>0\) for your demonstration and save them as
n1andn2Create a vector of proportions,
props, from 0 to 1, in steps of 0.01 (Tip: use theseq()function).- If I suggest a function you haven’t seen before, you can search its documentation in your console by typing a ? in front of the function name, e.g. ?seq.
Create a tibble (a data type in R, like a dataframe),
for_plot, with the vector ofpropsas the first variable, and two additional variables calculating the variance for each of your two chosen n values. (Call thesen1_varandn2_var)Create two plots, one for each of your values of \(n\), using
ggplotand applytheme_minimal()to each one. These should appear in your PDF and do not need to be saved with specific name.Add an appropriate figure caption to each chart (use fig.cap=“Your text here” in the R chunk settings).
- An appropriate title should succinctly explain the chart and mention the chosen n value.
Add a caption within the ggplot that says “Created by STUDENT NAME in STA303/1002, Winter 2022”.
Give the x and y labels appropriate labels.
5.5.3 Task 3: Demonstrating frequentist confidence intervals as long-run probabilities of capturing a population parameter
Goal: Simulate a population of size 1000, using \(N(10, 2)\), and take 100 independent, random samples of size 30 observations each from it. Calculate a Wald confidence interval (using an appropriate t-multiplier) for the population mean from each sample. Calculate what proportion of intervals contain the population mean and plot all these intervals, coloured by successful population mean capture or not.
5.5.3.1 Specific steps
Set the seed to the last three digits of your student ID (this is your numeric student identifier number, NOT your UTORID).
Set up the following objects with the appropriate simulation parameters, sample size and number of samples.
sim_meanandsim_sdsample_sizenumber_of_samples
Calculate the appropriate t-multiplier (function:
qt(...)) for constructing a 95% confidence interval in this context. Make sure your degrees of freedom are appropriate. Save it astmultfor later use.Create a vector called
population, a simulated population usingsim_meanandsim_sdand with 1000 values (function to generate random numbers from a normal distribution:rnorm(...)).Find the actual true mean for your population and save it as
pop_param. This should be a numeric vector of length 1.Get 100 samples of size 30 from your population and save them in a vector called
sample_set. (This might be a little tricky/unfamiliar, so here is one way to do it. You can just copy and paste this code.)
sample_set <- unlist(lapply(1:number_of_samples,
    function (x) sample(population, size = sample_size)))
Create a new vector called
group_idthat will allow you to label the values from the 100 different samples above. Hint:rep(…)will be useful here, and has a great little argument calledeach. Take a look at the documentation (?rep) to compare the behaviour oftimesandeach.Create a new
tibble(a data type in R, like a dataframe),my_sim, that has two columns:group_idandsample_set.Create a new tibble,
ci_vals, that starts with the datasetmy_simand then groups bygroup_id, and summarizes appropriately to create two new columns:meanandsd, that hold the means and standard deviations. There should be one row per group.Continue to change the tibble
ci_valsby adding the following variables:lowerandupper, two columns that hold the lower and upper bound of a 95% confidence interval for the group. You will need to calculate this. Consider the equations for a confidence interval and remember that we are using a t-multiplier that you have already calculated.capturewhich takes the valuesTRUEif the population parameter is in the 95% CI, andFALSEif not. These should be logical NOT character types.
Create an object called
proportion_capturethat usesci_valsand stores the proportion of intervals you created that capture the population parameter. This should be done using the object names, not ‘hard coded’, so that if you changed your set.seed or your sample size, etc., and run all the code again, it would update this value. It should be a vector of length 1.Plot these 100 confidence intervals in one plot, with the means indicated as points, as well as and a dotted line for the population parameter.
geom_errorbar()will be very helpful.Colour the confidence intervals by whether or not they contain the population parameter.
- If the interval include the population parameter, colour it #122451 if it DOES contain the parameter (TRUE) and #B80000 if it DOES NOT (FALSE).
Set the figure caption to “Exploring our long-run ‘confidence’ in confidence intervals. This figure shows how often 95% confidence intervals from 100 simple random samples capture the population mean. The population was simulated from N(10, 2)”.
Set the caption to “Created by STUDENT NAME in STA303/1002, Winter 2022”. Replace STUDENT NAME with your name.
Set the legend title to “CI captures population parameter”.
Flip the coordinates using
coord_flip()so the intervals are horizontal across your chart.
Add the following sentence to your Markdown (not in a code chunk):
\(`\)r proportion_capture*100\(`\) % of my intervals capture the the population parameter.
Important! Use BACKTICKS around r proportion_capture*100. Things you put in backticks with an r at the beginning will be processed as inline R code. This key is located under the escape button on many keyboards.You may need to remove some spaces compared to the above.
Briefly (~1 paragraph) describe why we can include the population parameter in this plot AND why we cannot usually compare the population parameter to our confidence interval in practice (e.g., when working with data that has not been simulated). Write this for a non-statistical audience.
5.5.3.2 Objects that must be carefully assigned to pass autograding
sim_meanandsim_sdsample_sizenumber_of_samplestmultpopulationpop_paramgroup_idsample_setmy_sim, tibble with two columnsci_vals, tibble with 6 columns (after all steps completed) (See Errata for note)proportion_capture
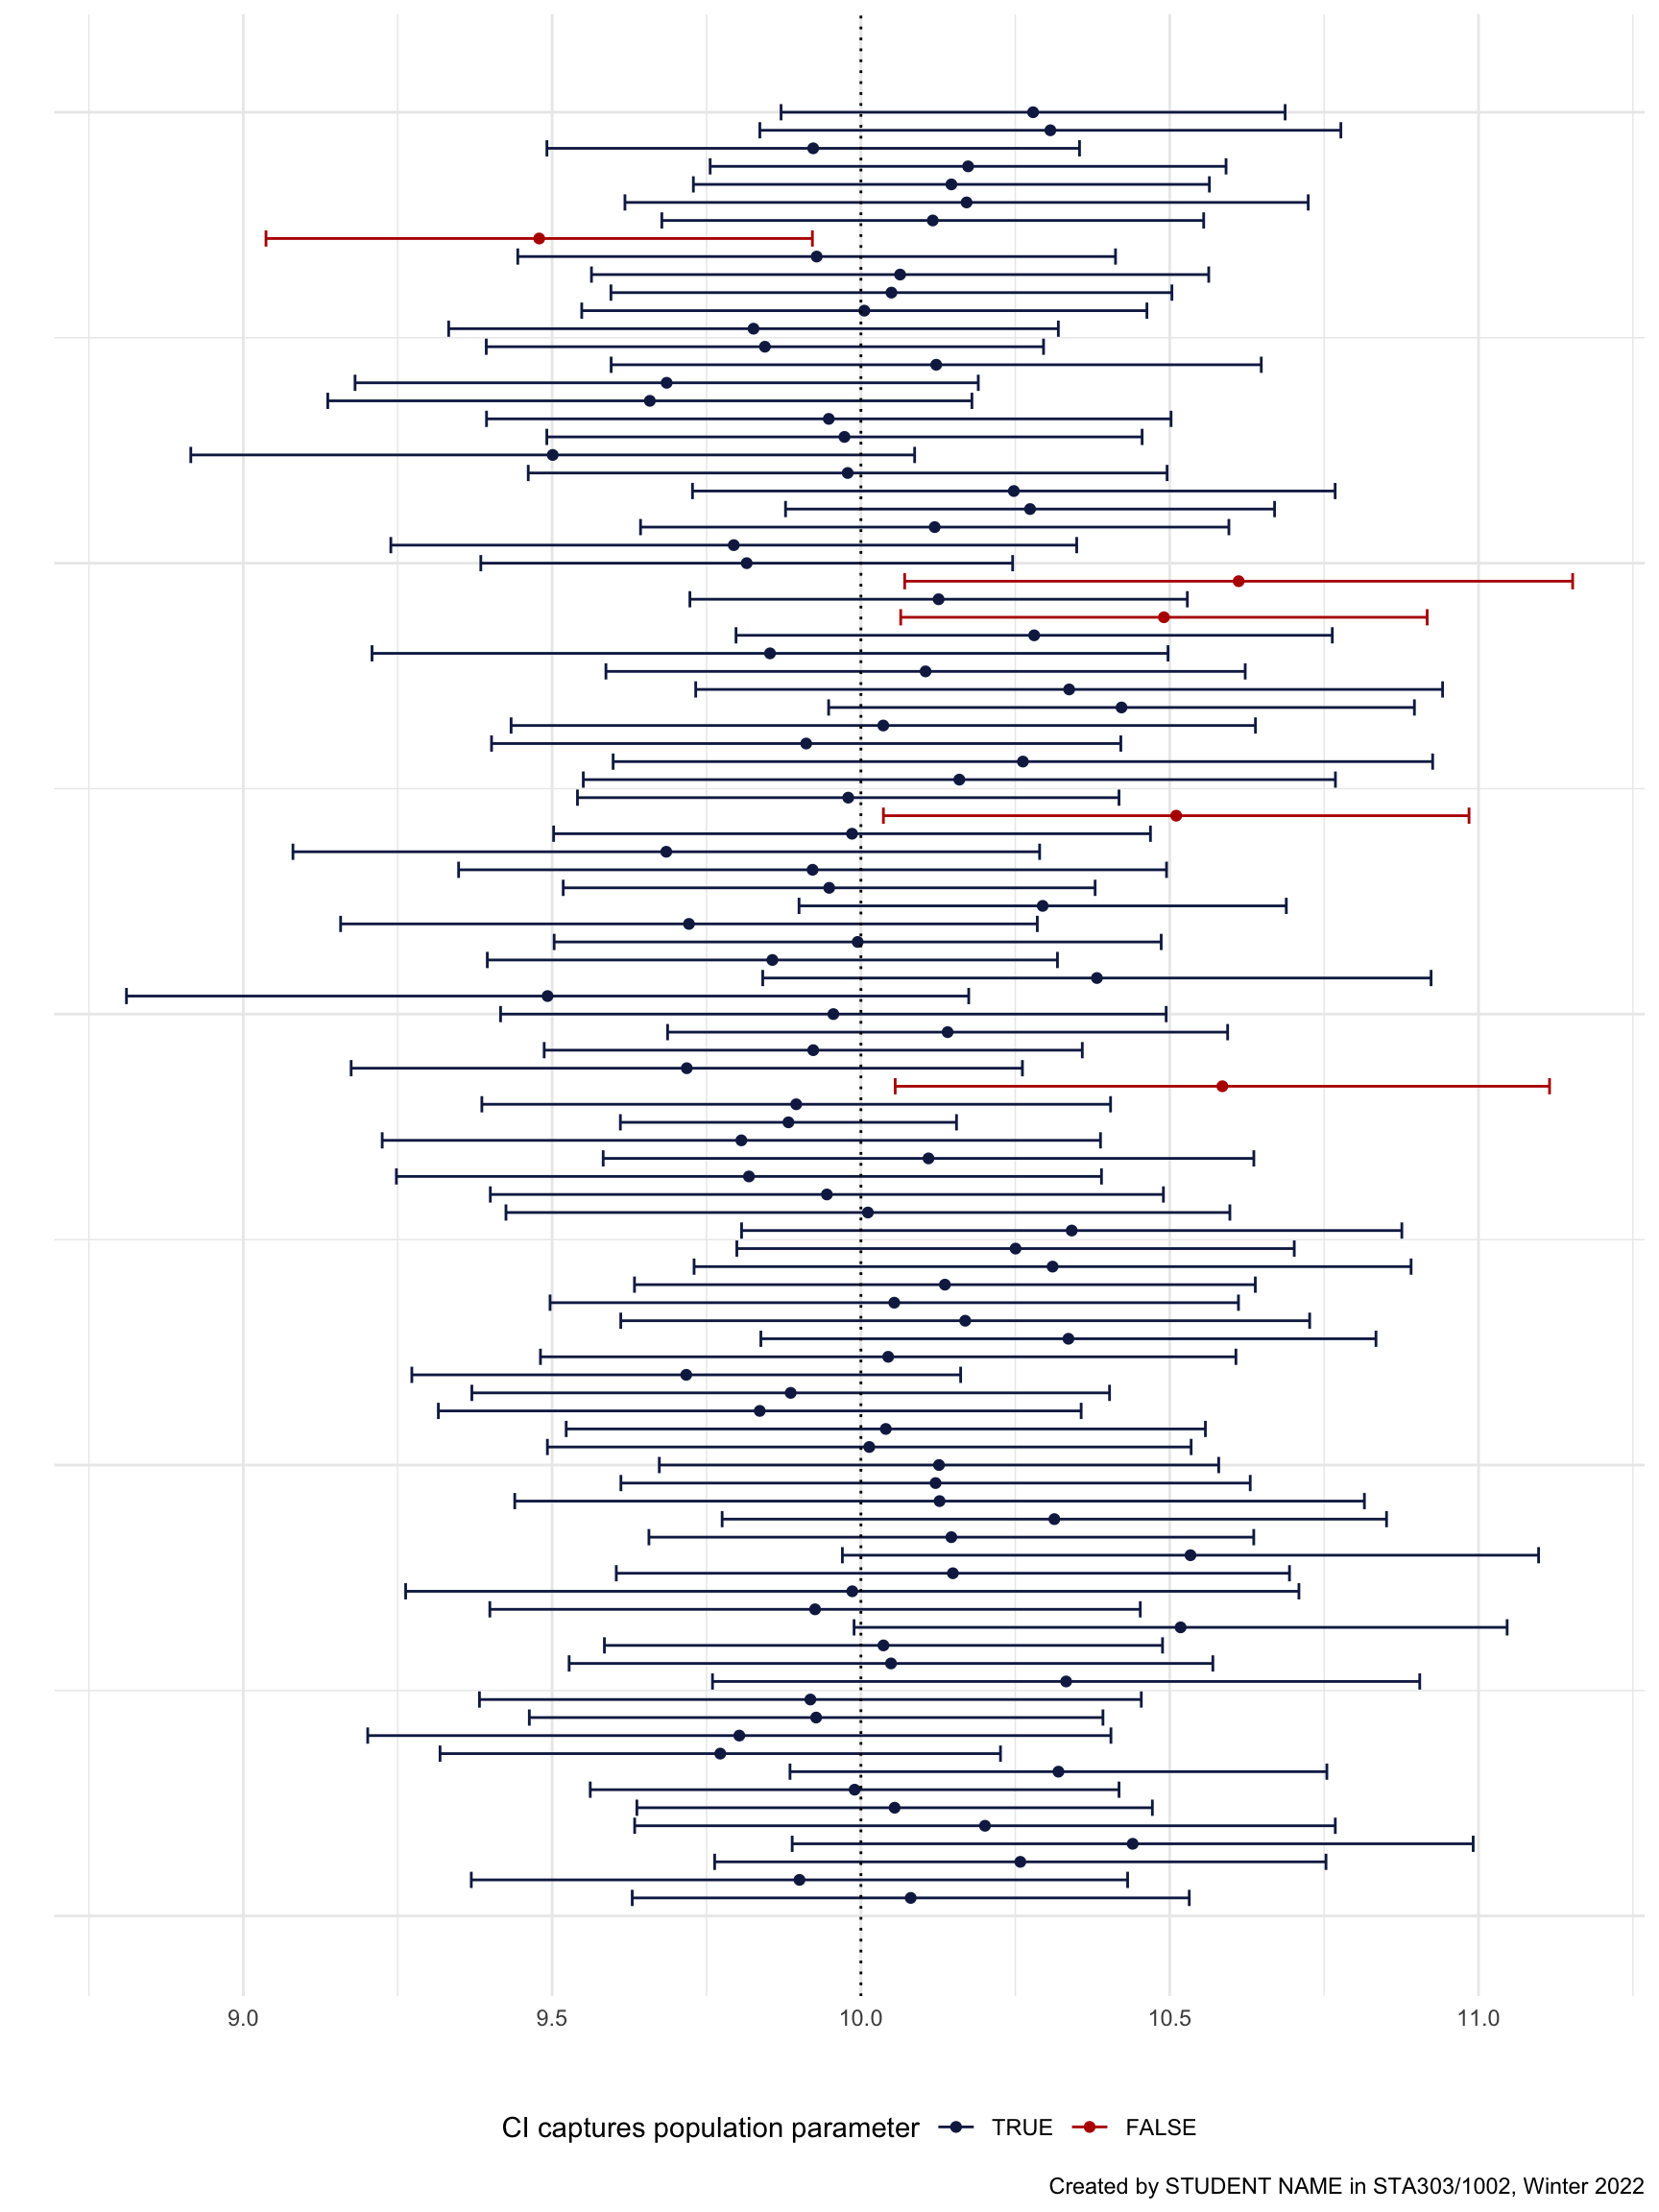
Figure 5.1: This is generally what your output should look like for the confidence interval task. Note: It won’t be exactly the same.
5.5.4 Task 4: Investigating whether there is an association between cGPA and STA303/1002 students correctly answering a question on global poverty rates
In the ‘getting to know you’ survey at the beginning of STA303, students who participated in the survey were asked:
- What their current cumulative grade point average (CGPA) was at U of T.
- Whether the proportion of people living below the global poverty line had halved, doubled or stayed about the same in the last 20 years.
So, what was the correct answer to the question about global poverty? The proportion of the global population living below the poverty line has HALVED!
In the .xlsx file called sta303-mini-portfolio-poverty.xlsx there are 200 observations that represent the patterns in our class but from which is is not possible to identify individual students. The final goal of this task is to test whether there is a difference in cGPA between students who correctly answered this question and those who did not.
5.5.4.1 Goal
- Briefly describe the goal of this task to someone who has not read these instructions and only has a general awareness of hypothesis testing. Put it in your own words.
5.5.4.2 Wrangling the data
- Load the data,
sta303-mini-portfolio-poverty.xlsx,into an object calledcgpa_data, and apply theclean_names()function from thejanitorpackage. Pay attention to the path to the file when providing it to R. It won’t know to look in the data folder if you don’t tell it.
- Rename the cGPA variable to
cgpaand the poverty question answer toglobal_poverty_ans.
- Clean the data so only appropriate cGPA variables are included.
- Create a new variable called
correctthat takes the value TRUE (logical, not character) if the respondent answered ‘Halved’ and FALSE if they answered ‘Doubled’ or “stayed about the same’.
All of the above changes should be saved into the dataset called cgpa_data. I recommend using pipes %>%. There is a keyboard shortcut too: Cmd+Shift+M (Mac) or Ctrl+Shift+M (Windows).
5.5.4.3 Visualizing the data
- Create a set of histograms, in one figure, positioned on top of each other, that will allow you examine the data in a useful way.
5.5.4.4 Testing
Choose an appropriate test to test whether there is an association between cGPA and if a student in STA303/1002 answered this question correctly. JUSTIFY your choice appropriately.
Conduct the test AND the equivalent version using
lm()interpret the result of the test appropriately in a sentence or two.
Recall the types of tests you have now encountered, in this and previous courses:
- T-test
t.test(x, data = my_data)ort.test(x~y, data = my_data) - ANOVA `summary(aov(x~y, data = my_data))
- Wilcoxon test
wilcox.test(x, data = my_data) - Mann-Whitney U
wilcox.test(x~y, data = my_data)(note different use of wilcox function) - Kruskal-Wallis Rank Sum test
kruskal.test(x~y, data = my_data)
Make sure you’re considering the assumptions for the tests as well as some of the other criteria about which tests we choose to reach for. You may need ask some questions in office hours or find relevant readings to help you consider the non-parametric tests. Your strategies here might be something to consider in your reflection.
5.6 Writing sample
5.6.0.1 Prompt
Read the below job ad and write about the skills you would need to apply. Write on at least 2 soft skills and 2 analytic skills. The ad targets those with a MSc/PhD or those with 2+ years of experience, but imagine this requirement is not there.
Soft skills. What soft skills relating to communicating and working with others does the company seek?
In what way do you already possess two of these skills?
What evidence do you have of possessing one or two of these skills?
Analytic skills. What analytic skills relating to software use and performing data analysis does the company seek?
In what way do you already possess two of these skills?
What evidence do you have of possessing one or two of these skills?
Connection to studies. What other skills can you develop and what evidence can you accumulate during the remainder of your education to be ready for a similar job ad?
Structure your answer under five headings: ‘Introduction’, ‘Soft skills’, ‘Analytics skills’, ‘Connection to studies’ and ‘Conclusion’. Write your answers in full sentences, with appropriate paragraphing. There should be a brief introduction and conclusion. Imagine a future employer or graduate school admission officer was reading this, you should explain what you are going to do, do it (the three headings) and then sum up what you did.
Word count: 300–500 words. Please add a statement of your word count at the end of the passage.
Yelp logo
5.6.0.2 Job add
5.6.0.2.1 Data Scientist (Remote)
Category Data Science & Analytics
Location Toronto, Ontario, Canada
Department Engineering and Product
At Yelp, it’s our mission to connect people with great local businesses. Yelp’s unique dataset contains billions of interactions between users and local business around the globe, from a user reviewing a neighborhood coffee shop to requesting a repair quote with a photo of a leaky faucet. Data Scientists at Yelp work to make sense of these interactions to deliver impactful analyses and products to our users, business partners and the general public.
The Data Science team performs analyses, builds models, and designs experiments that directly impact Yelp’s business and users. Our centralized team is the most wide-ranging consumer of data at Yelp, adept at tasks from modeling content growth and user behavior to sharing insights about the health of local economies. With varied backgrounds and expertise, we strive for learning and growth in a collaborative environment.
We’d love to have you apply, even if you don’t feel you meet every single requirement in this posting. At Yelp, we’re looking for great people, not just those who simply check off all the boxes.
This opportunity is fully remote and does not require you to be located in any particular region. We welcome applicants from throughout Canada.
We Are Looking For:
3+ years of experience as a data scientist or MS/PhD and 2+ years of industry experience in a quantitative role.
Fluency with SQL and Python or R for data analysis.
Solid understanding of statistical inference, experimental design and analysis.
Enthusiasm for clean code and sharing reproducible results.
Communication skills to work with partners on engineering, product and business teams.
An eye for great data visualization with Matplotlib, Plotly, ggplot, or Tableau.
If you don’t have 2+ years of industry experience in a quantitative role, please take a look at our College Data Scientist roles instead!
Where You Come In:
- Define key metrics to track Yelp’s performance and inform product decisions.
Assess and frame questions from partners into actionable deliverables.
Design, execute, and analyze complex experiments impacting millions of users.
Devise and evaluate models for diverse business needs, such as identifying growth opportunities, personalizing user experience, and matching consumers to businesses.
Own analyses start-to-finish and communicate key insights to stakeholders.
Share your technical skills to develop and maintain high-quality, reusable analysis tools.
5.6.0.3 LI-Remote
At Yelp, we believe that diversity is an expression of all the unique characteristics that make us human: race, age, sexual orientation, gender identity, religion, disability, and education — and those are just a few. We recognize that diverse backgrounds and perspectives strengthen our teams and our product. The foundation of our diversity efforts are closely tied to our core values, which include “Playing Well With Others” and “Authenticity.”
We’re proud to be an equal opportunity employer and consider qualified applicants without regard to race, color, religion, sex, national origin, ancestry, age, genetic information, sexual orientation, gender identity, marital or family status, veteran status, medical condition or disability.
We are committed to providing reasonable accommodations for individuals with disabilities in our job application process. If you need assistance or an accommodation due to a disability, you may contact us at accommodations-recruiting@yelp.com or 415-969-8488.
Note: Yelp does not accept agency resumes. Please do not forward resumes to any recruiting alias or employee. Yelp is not responsible for any fees related to unsolicited resumes.
Accessed from Yelp® on Feb 28, 2021, 15:15 PM
Large logo from Wikipedia https://en.wikipedia.org/wiki/Yelp#/media/File:Yelp_Logo.svg
5.7 Reflection
Briefly, 100 to 200 words each, answer the following questions:
What is something specific I’m proud of in this mini-portfolio?
How might I apply what I’ve learned and demonstrated in this mini-portfolio in future work and study, after STA303/1002?
What is something I’d do differently next time?
5.8 Rubric
There is a breakdown of the overall contribution of each component to your grade below, followed by a more detailed rubric.
| Component | Percentage for component |
|---|---|
| Cover page | 1% |
| Introduction | 5% |
| Statistical skills sample | 60% |
| Commenting of code | 1% |
| Readability of R code | 1% |
| Reproducibility | 2% |
| Writing sample | 20% |
| Reflection | 5% |
| General (multiple components) | 5% |
| Component | Subcomponent | Poor or missing (0%) | Adequate (50%) | Good (75%) | Excellent (100%) | Points |
|---|---|---|---|---|---|---|
| Cover page | Cover page | Not all required cover page components are present | N/A | N/A | All required cover page components are present | 1 |
| Introduction | Introduction | Missing OR significantly off topic OR totally inappropriate for audience OR longer than one page. | Some evidence of understanding of the course and the skills demonstrated in this assessment shown, but lacks clarity/specificity. May be someone inappropriate for specified audience. No longer than one page. | Introduction provides a mostly specific introduction to the mini-portfolio, explaining the context of the work and describing the skills demonstrated with mostly reasonble understanding. It is no longer than one page. | Introduction provides a succint and specific introduction to the mini-portfolio, explaining the context of the work and comprehensively describing the skills demonstrated. It is no longer than one page. | 5 |
| Statistical skills sample | Task 1 | Missing or significant issues with completion of instructions for this task. | Correct libraries loaded but several instructions not followed. | Correct libraries loaded, but chunk may not be named or printed in the PDF appropriately. | Correct libraries loaded without package messages being included in the PDF, and the chunk is named ‘setup’. This code chunk appears in the PDF, under the appropriate heading. | 1 |
| Statistical skills sample | Task 2 code and chart | Missing or goal not achieved. | A reasonable attempt made to complete the instructions, but with so many omissions or error that the goal is not fully achieved. | Most instructions correctly followed and mostly appropriate charts produced, but some major omissions or errors or a large number of minor errors. | All instructions correctly followed and appropriate charts produced. A small number of minor errors allowable. | 5 |
| Statistical skills sample | Task 3 code and chart | Missing or goal not achieved. | An attempt made to complete the instructions, but appropriate plot not created generated. | Most instructions correctly followed and a mostly appropriate chart produced, but some major omissions or errors or a large number of minor errors. | All instructions correctly followed and appropriate chart produced. A small number of minor errors allowable. | 10 |
| Statistical skills sample | Task 3 writing | Missing or more than one of the issues in the Adequate column. | Statement of % of intervals that capture the population parameter is incorrect OR hardcoded OR major incorrect claims made OR part of prompt not addressed. | Statement of % of intervals that capture the population parameter is correct and set programmatically (not hardcoded). A mostly clear and correct explanation of why we can show the pop parameter on this chart AND appropriate discussion of why this is not usually the case in practice. Minor omissions allowable, but should not make any incorrect claims. | Statement of % of intervals that capture the population parameter is correct and set programmatically (not hardcoded). Clear and correct explanation of why we can show the pop parameter on this chart AND appropriate discussion of why this is not usually the case in practice. | 12 |
| Statistical skills sample | Task 4 goal | Missing or more than one of the issues in the Adequate column. | Attempt made to put goal in own words, but paraphrasing insufficient OR description of goal includes many errors OR description inappropriate for the audience. | Goal correctly stated and put into own words, but may lack some clarity OR not be somewhat inappropriate for the audience. | Goal clearly, correctly and succinctly stated in the writers own words, in a way that is appropriate for the specified audience. | 5 |
| Statistical skills sample | Task 4 wrangling | Missing or goal not achieved. | An attempt made to complete the instructions, but final dataset | Most instructions correctly followed. | All instructions correctly followed. | 5 |
| Statistical skills sample | Task 4 viz | Missing or significant issues with completion of instructions for this task. | An attempt at a plot that would fulfil the instructions, but many errors or omissions. (Carryover errors from wrangling ignored.) | Mostly correct plot produced. (Carryover errors from wrangling ignored.) | Fully correct plot produced. (Carryover errors from wrangling ignored.) | 7 |
| Statistical skills sample | Task 4 test | Incorrect test chosen OR major errors in interpretation of p-value. | Correct test chosen, but without sufficient justification OR p-value description incorrect/missing OR incorrect test chosen but everything else done to good level. | Correct test chosen but justification somewhat lacking OR lm() implementation missing OR p-value interpretation had minor errors OR incorrect test chosen but everything else done to excellent level. | Correct test chosen and clearly justified. Both versions (test function + lm()) correctly implemented and interpretation of p-value correctly put into plain language. | 15 |
| Commenting of code | Commenting of code | No relevant comments or some comments, but limited or inappropriate. | Some reasonable comments, though they would be only limited use to a reader. | Reasonable comments, though may be unhelpful to a reader in some sections. | Code is well-commented and so that a new reader could pick up and get a strong idea of what was being done, where—even if they are not an R coder. | 1 |
| Readability of R code | Readability of R code | No R code in document OR major issues in clarity of code as to be mostly unreadable. | Code is mostly well formatted, but some inappropriate choices make some sections difficult to read. | N/A | Code is well formatted and easy to read. | 1 |
| Reproducibility | Reproducibility | Rmd does not successfully knit OR was not included in the upload. | Minor changes need to be made to the Rmd to successfully knit to PDF AND/OR PDF not included in submission. | N/A | Rmd can be run to recreate the submitted PDF exactly AND both Rmd and PDF were submitted. E.g., Seeds set correctly and no errors that prevent knitting. | 2 |
| Writing sample | Addresses prompt | No response OR does not address one of the prompts for this week. | While the prompt is somewhat addressed, there is a lot missing and/or much of the response is not relevant/off-topic. | Prompt is addressed, though may go somewhat off-topic at points, or lacks some depth in its coverage. | Prompt is clearly and comprehensively addressed. | 8 |
| Writing sample | Structure | No response OR there is no structure, very difficult to follow. | Some structure but difficult to follow. | The organization follows a mostly logical structure, with some issues in paragraphing OR meets criteria for excellent but word count not included at the end. | Well organized, follows a logical structure. Word count included at the end. | 2 |
| Writing sample | Introduction | No response OR there is no concluding sentence(s). | An introduction is present but is only weakly connected to the topic/body of the writing sample or very somewhat generic. | An introduction is present but may lack some connection to the topic/body of the writing sample or is somewhat generic. | A clear introduction succinctly introduces the central ideas and purpose of this writing sample. | 5 |
| Writing sample | Conclusion | No response OR there is no concluding sentence(s). | The conclusion is weak not well supported. | A conclusion is present but does not completely summarise the central ideas. | A clear conclusion summarizes the central ideas. | 5 |
| Reflection | Reflection | No reflection OR prompts not addressed appropriately/answers off topic OR inappropriate tone for reflection in a professional context. | Majority of prompts addressed appropriately, but may be overly general AND/OR lack evidence of thoughtful reflection AND/OR the tone may be somewhat inappropriate for a professional context. | All prompts are addressed appropriately. Reasonably clear and mostly specific, though perhaps with some overly general comments that are not more deeply developed. Evidence of some good reflective though. Tone is appropriately professional for academic/work context. | All prompts are answered clearly and specifically. Strong evidence of reflective thought. Tone is appropriately professional for academic/work context. | 5 |
| General (multiple components) | Writing mechanics | Several missing written components OR considerable writing and grammatical issues that completely obscure the meaning OR lots of slang and inappropriate word choice. | Multiple sections are difficult to read, but is otherwise understandable. | Slight difficulty in understanding one or two sections. | Can read and follow along with minimal effort. Some grammatical or word choice errors are allowable, but they must not obstruct meaning. | 5 |